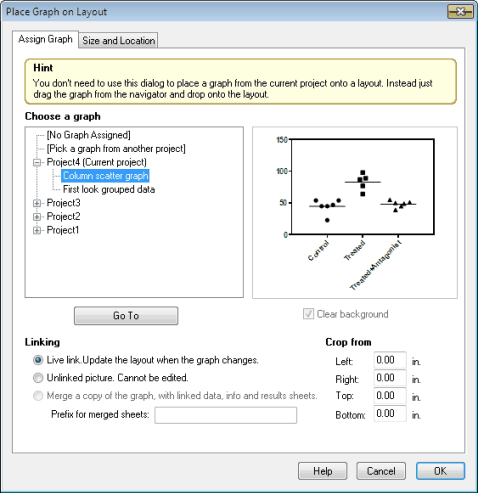
Choose a graph
Note that you can not only choose a graph from the current project, but a graph from any project. It is especially easy to choose a graph from another open project. If you choose to Pick a graph from another project that is not open, after you choose that project file, Prism will open it.
Linking within a project
By default, Prism the graph on the layout automatically updates when the graph itself updates. You can choose to place the graph on the layout as an unlinked picture with no link to the original data.You might prefer this option if you are sure the graph is 100% done, and you don’t want to allow any possibility of it being changed. It can also be useful if you want to keep "snapshots" of a graph as a project continues and additional data are collected and graphed.
Linking between projects
If you choose or paste a graph from another project, you'll have three choices:
•Merge a copy of the graph, along with its data tables and analyses, into the project you are working on now. The advantage of this approach is that everything will be in one project. The disadvantage (which some consider to be an advantage) is that the data will now exist in two files. Another advantage is that your file is self-contained. Even if you move it to a different computer, everything will work.
•Live link. The data and graph are not in the project with the layout. To edit a linked graph, go to the original project. Then resave that file and the changes will appear in the layout. Prism can maintain the link only if the name and location of the linked file doesn't change. If you change computers, you'll almost certainly break the link. The advantage of linking (which some will consider to be a disadvantage) is that the data and graph only exist in one place.
•Unlinked picture. As the name suggests, this is just a picture that is not linked to any data or any editable graph.
Cropping
The first tab of the Assign Graph graph dialog lets you crop a graph to get rid of white space or portions of the graph you don't want to see on the layout. If you enter a negative value for any of the cropping values, you'll make the graph placeholder larger, adding white space in that direction.
The second tab (Size and Location) lets you add a border around the graph and change its size and position.