Prism 3 - Analyzing Contingency Tables using Fisher's Exact Test
Step-by-Step Examples:
Analyzing Contingency Tables using Fisher's Exact Test in Prism 3
A contingency table shows numerically the results of an experiment in which the outcome is a categorical variable. Commonly, two groups of subjects are studied, and there are two possible outcomes. Suppose you treat 126 subjects with either a placebo or a new drug designed to decrease the incidence of coronary artery restenosis within 6 months after angioplasty. The numbers of subjects experiencing each outcome may be arranged on a 2 x 2 contingency table as follows:
|
Restenosis within 6 months after angioplasty?
|
|||
|
Yes
|
No
|
||
| Treatment |
Placebo |
23
|
41
|
|
Drug-treated |
16
|
46
|
|
In this step-by-step example, we'll analyze this table using Fisher's Exact test to answer the following question: If there were really no association between treatment and occurrence of restenosis within the observation period, what would be the chance that random sampling would produce an apparent association as strong, or stronger, than that observed in this experiment?
Prism will analyze contingency tables not only for experiments, but also for cross-sectional, prospective, or retrospective case-control studies. To learn more about these distinctions or about contingency analysis in general, consult Analyzing Data with GraphPad Prism (pdf) .
Enter the Data
When you launch Prism, the Welcome to Prism dialog appears. Choose to Create a new project and to Work independently. Uncheck the option box at the bottom of the Welcome dialog to Pop up new user hints.
In the lower half of the Welcome dialog, tell Prism how to format your data table. For the X column, select Text (bar graph). For the Y columns, choose A single column of values.

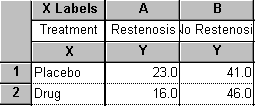
When you leave this dialog box, Prism displays the formatted table. Enter the data—numbers of subjects falling into each mutually exclusive category, not fractions or percentages—as follows:

| You must type in the four values for the contingency table. Prism will not cross-tabulate raw data to create a contingency table. |
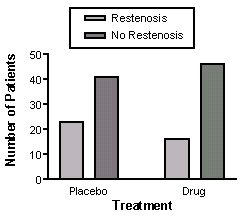
Click on the yellow Graphs on the toolbar to view the bar chart that Prism has produced automatically (our illustration includes some editing not discussed here). For more information, consult this step-by step example on working with bar graphs.

Choose the Analysis and the Options
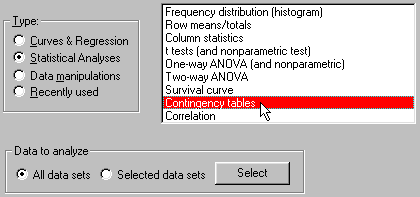
Click on the yellow Data tab to return to the data table. Click Analyze. In the Analyze Data dialog, select Statistical Analyses and Contingency tables. Accept the default setting to analyze All data sets.

In the Contingency Tables dialog, accept the choice of Fisher's exact test, which is the default when you're analyzing a 2 x 2 table.
| If your table is two columns by three or more rows, Prism will only do a Chi-square analysis. |
In the same dialog, set the checkboxes to do the optional Relative Risk calculation. All the settings are shown below; you can get more help understanding these settings by clicking Help me decide.
View the Results
When you leave the Parameters dialog, Prism runs the analysis and displays the results page. You can get help understanding the results by clicking the Interpret button.
Copyright (c) 2002, GraphPad Software Inc. All rights reserved.


